Statistical Analysis Services

Reliable and affordable statistical analysis solutions for businesses and organizations.

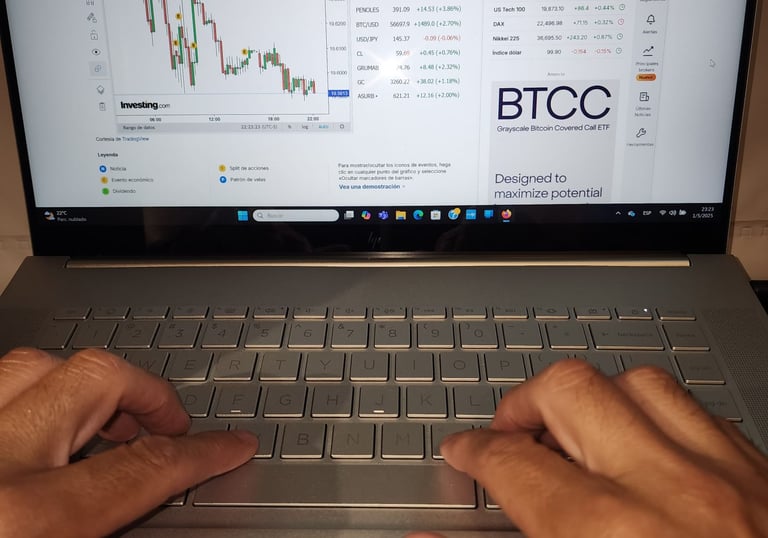
Data Analysis Solutions

We offer customized data analysis services for businesses, educational institutions, government agencies, and academic thesis projects

A person is looking at a computer screen displaying a document titled 'Overview - All Private Equity - Fundraising, Investments, & D'. The document contains statistical charts and graphs related to private equity market statistics from 2007 to 2022. Various tabs and functions like 'File', 'Home', 'Insert', and 'Design' are visible in the interface.
Consulting Services

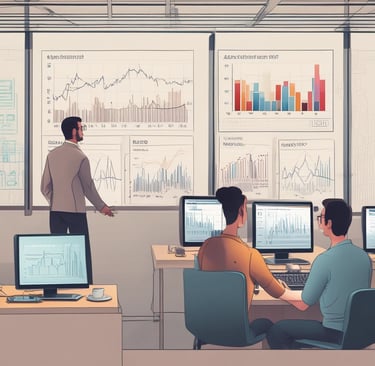
Our consulting services are designed to support evidence-based decision-making, driving measurable improvements in organizational efficiency.

We have expertise in the use of statistical software and georeferencing tools, as well as in the implementation of customized training programs designed to strengthen statistical analysis skills for professionals and organizations.

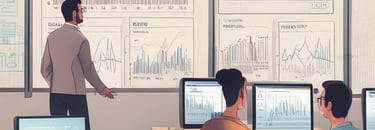
Advanced Technical Capabilities and Tools
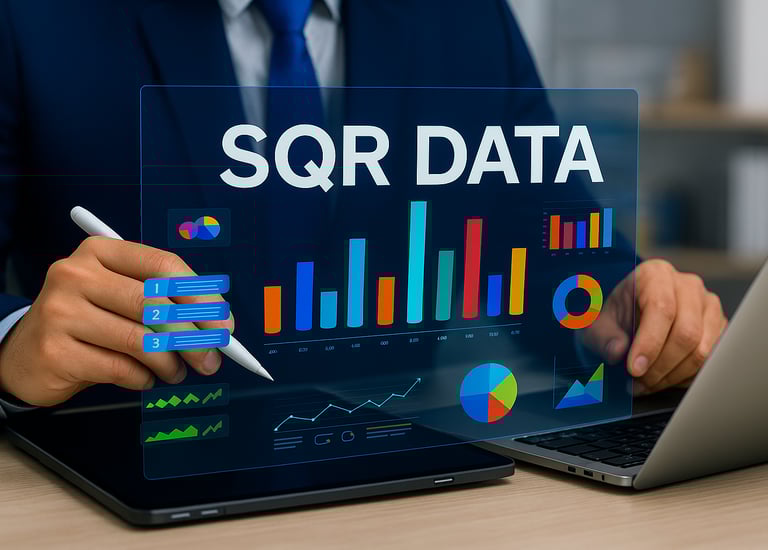
A person with a striped shirt and a cap is standing in front of a computer screen displaying data and analytics. Another laptop is open on a desk below the monitor, and a large metallic tank with a pressure gauge is nearby.

Data Solutions

Reliable statistical analysis for businesses and organizations in need.

A digital dashboard displaying various analytics charts and graphs. There is a line graph showing user engagement over time on the left, a section with total revenue marked as $74K, and bar charts illustrating user statistics by region. The central section highlights users in the last 30 minutes, focusing on different countries such as the United States, Canada, India, Pakistan, and Brazil.
Statistical Analysis

We provide support in decision-making through data-driven solutions, backed by extensive experience in sampling techniques and the observation of relevant variables.

A person is holding a smartphone displaying an analytics or insights screen with various metrics and numbers. The individual is wearing a casual white shirt and a watch with a black band. The surrounding environment includes an indoor plant.
Educational Support

We support institutions in data analysis to improve outcomes and optimize resource use. Our team includes professionals with over 15 years of experience in statistical education, and we provide specialized guidance to students in the analysis of data for undergraduate and graduate thesis projects.
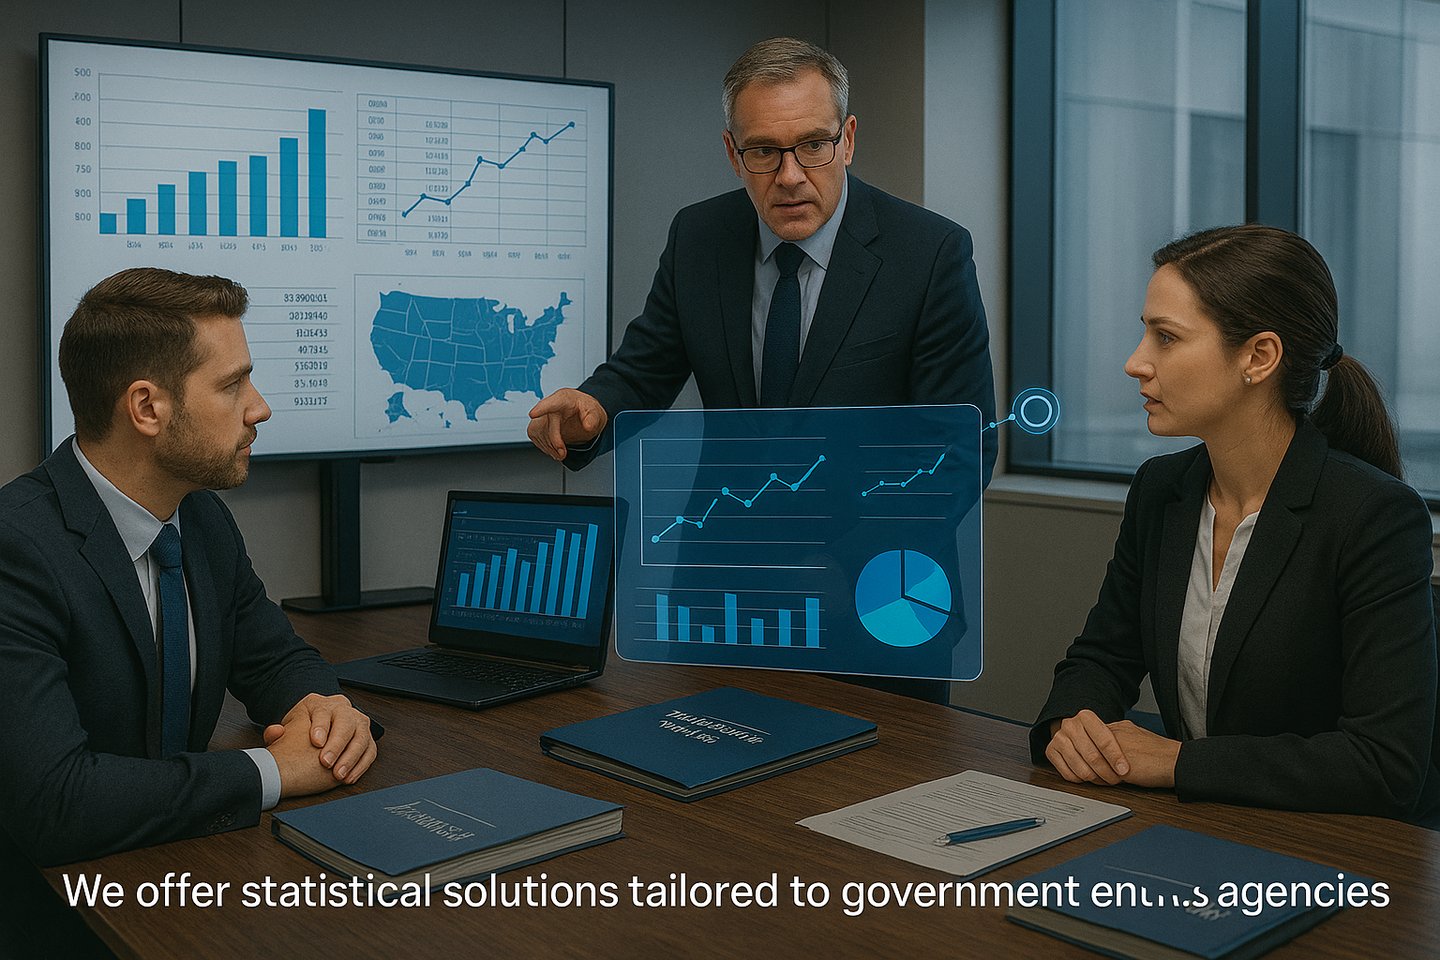
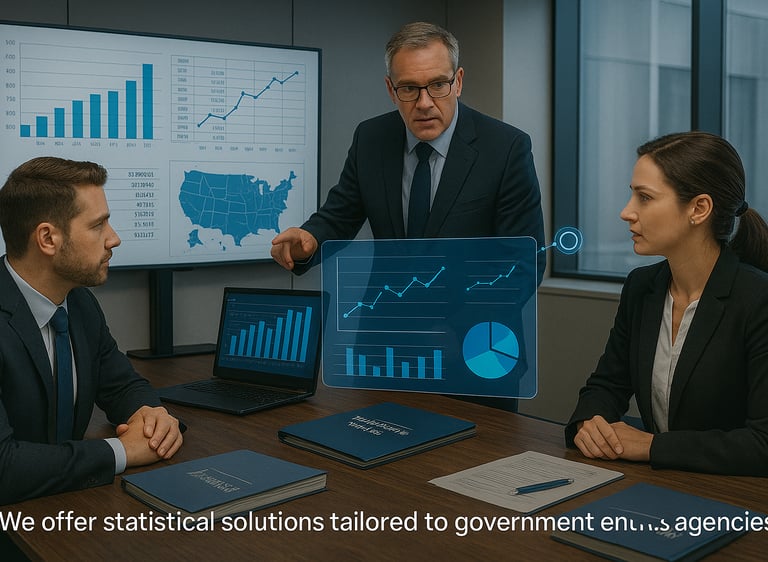
A promotional banner with a bold red background features the text 'Data has a better idea' in large white letters. Above the text, the word 'HIVERY' is printed along with a stylized logo resembling a beehive. The background also includes a pattern of blue circles and dots, giving a digital or technological feel. In the surrounding area, there's a partial view of a desk and some office supplies.
A digital chart display featuring a green line graph against a dark background, with data units labeled in white text. The line graph suggests an analysis of data volume, with sharp peaks and valleys. The lower portion of the graph is highlighted in red, indicating critical data points or alerts.
Government Services

We offer statistical solutions tailored to government entities and agencies, with extensive experience in the analysis of administrative records to produce relevant statistical information that supports decision-making.

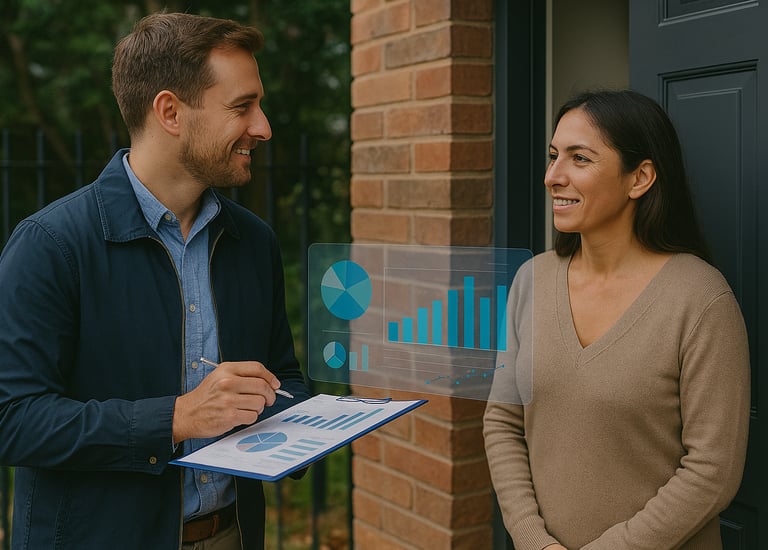
Social Organizations

We empower social groups through reliable data analysis services, survey design, data collection, and statistical analysis.

SQR Data Solutions provided exceptional statistical analysis that greatly improved our decision-making process and boosted my indoor soccer project. They were excellent professionals.

Wilmer S.

Two laptops display dark-themed screens; one shows analytical graphs and statistics, including conversion rates, store sessions, and geographic distribution. The other screen displays a grid of web application icons. The scene is dimly lit, emphasizing the glow from the screens and the softly illuminated keyboards.
A laptop displays a detailed financial chart with lines showing data trends. In the background, a person is partially visible, wearing a dark shirt with the words 'most valuable' and some logos printed on it. The setting appears to be a modern workspace.

★★★★★